
Titration Curves and Conductivity Graphs
Dot-Point 2: investigate titration curves and conductivity graphs to analyse data to indicate characteristic reaction profiles, for example: strong acid/strong base, strong acid/weak base, weak acid/strong base (ACSCH080, ACSCH102)
Over the course of a titration, the pH of the analyte or the conductivity of the solution will change in predictable patterns depending on the strength of the acid and base involved. These changes provide valuable information about the progress of the titration and the nature of the substances involved.
What is Conductivity?
Conductivity refers to the ability of a substance to conduct electricity, which depends on the presence of mobile charged particles (like ions or free electrons) that can move through the solution.
Substances are conductive if they contain ions that can move freely. For example:
Metals are conductive because they have free-moving electrons.
Saltwater is conductive because it contains dissociated ions like Na+ and Cl-.
Deionised water is not conductive because it lacks ions.
In titrations, the mobile charge carriers are typically the hydrogen ions (H3O+) or hydroxide ions (OH-), which play a crucial role in conductivity changes.
Features of Titration and Conductivity Curves:
Both pH and conductivity graphs help us understand what happens during a titration:
Initial pH or conductivity: Indicates the strength of the analyte (the substance being titrated).
Changes during titration: Reflect the neutralization process or the shifting of ions.
Equivalence point: The point where neutralization is complete (in pH, this is where the curve levels off; in conductivity, it’s where the curve flattens or changes direction).
Post-equivalence behaviour: Indicates the excess titrant and the resulting solution strength.
Three Types of Titration Curves:
Strong Acid/Strong Base Titrations

Titration Curve:
pH starts low due to the strong acid dissociating completely, [H+] is initially high.
pH increases gradually as the base is added and neutralizes the acid, [H+] drops .
The pH increases sharply around the equivalence point (which is pH 7 due to the neutral salt formed) as H+ has been completely neutralised by added base.
After the equivalence point, pH continues to rise at a decreasing rate due to the the excess base being added and the logarithmic nature of pOH.
Conductivity Graph:

High conductivity initially due to the presence of many H+ ions from the strong acid.
Conductivity decreases as H+ ions are neutralized by the base.
At the equivalence point, the conductivity is at its lowest, as H+ and OH- ions have been neutralized, leaving only the salt ions.
After equivalence, conductivity increases again as excess OH- ions are added.
2. Strong Acid/Weak Base Titrations
Titration Curve:
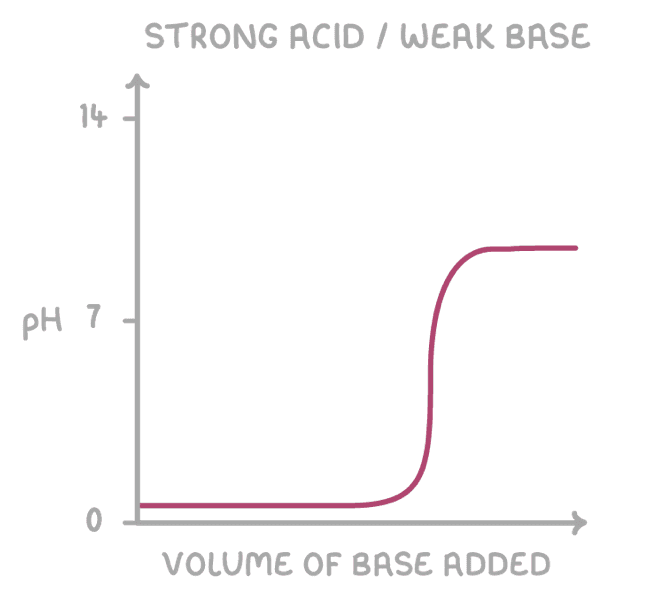
pH starts low due to the strong acid.
pH increases as the base neutralizes the acid, but the increase is not as sharp as in a strong acid/strong base titration.
Equivalence point occurs at pH < 7, indicating that the salt produced is acidic.
After equivalence, the pH increases at a slower rate.
Conductivity Graph:
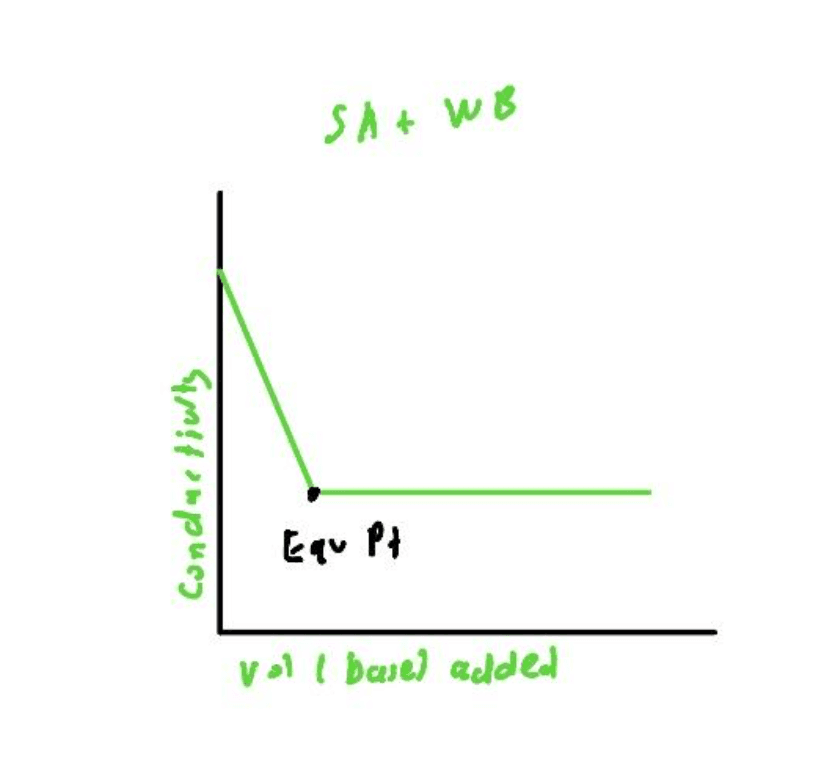
High conductivity due to the strong acid.
Conductivity decreases as H+ ions are neutralized.
Lowest conductivity is at the equivalence point, where only bulky salt ions are left in solution.
The conductivity stays relatively stable due to the weak base’s limited dissociation.
Weak Acid/Strong Base Titrations
Titration Curve:

pH starts moderate (~3-5) because of the weak acid.
The pH increases sharply initially as the strong base reacts with free H+ ions.
Buffering region occurs where the weak acid continues to neutralise the base but continually resists change in [H+] in accordance with LCP.
At the equivalence point, the pH is greater than 7 due to the basic nature of the salt formed.
After equivalence, the pH increases slowly.
Conductivity Graph:
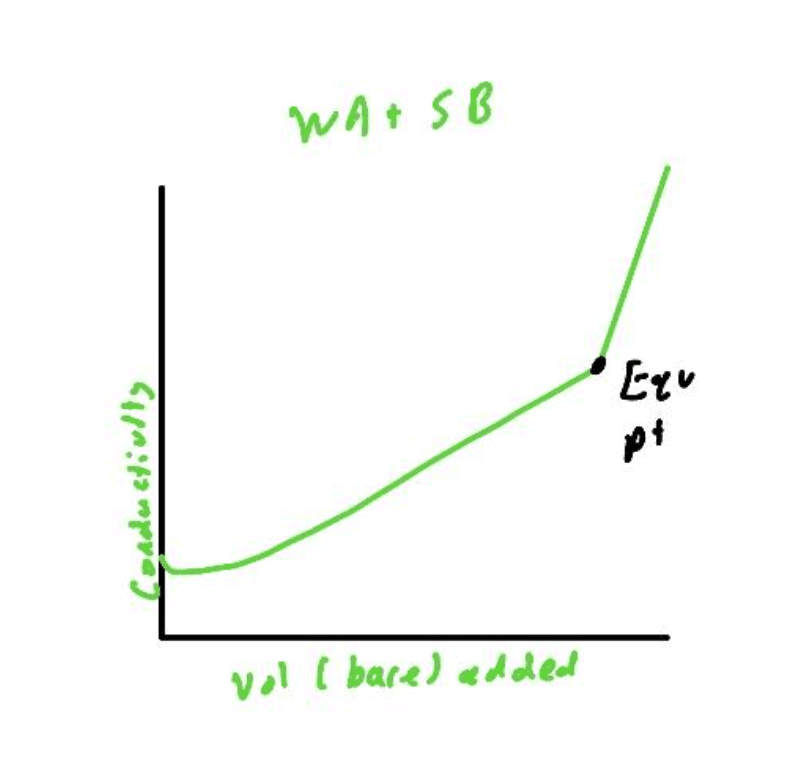
Low initial conductivity due to low concentration of H+ ions from the weak acid.
Conductivity decreases as H+ ions are neutralized.
The buffering region causes a slight increase in conductivity as the salt ions are released into solution whilst [H+] remains relatively unchanged due to the buffer
At equivalence, conductivity changes gradient suddenly because the strong base has been neutralized, and the excess OH- starts to increase conductivity.
Increasing conductivity after equivalence, since added base dissociated completely


